Using dot to Help Visualize Data Structures
- 6 minutes read - 1258 wordsRecently I was practicing building an implementation of a binary search tree (BST), an important data structure often discussed in interviews, in JavaScript. While iterating, I found the ability to draw pretty pictures (“directed graphs”) of the structure helpful. This became even more important when the data collection got big or when the operation got complex e.g. deletion of an interior node with re-homing of “orphans”.
In this post, I’ll show how to get started with visualizing complex structures
with directed graphs. At the end of this post, you’ll see how I created a BST
from a shuffled Array of Integers and displayed its structure as an image
file using Graphviz. While we’ll be working with a BST, this technique is
helpful for many data structures, and the odd diagram needed to communicate
with your team. Along the way, we’ll see how the approach we’re taking aligns
with “The Unix Philosophy.”
With this knowledge, instead of inspecting a BST like this with console.log():
{
  root: Node {
    value: 33,
    left: Node { value: 3, left: null, right: null },
    right: Node { value: 72, left: null, right: null }
  }
}
we can look at:

That seems easier to reason about to me!
The Unix Philosophy
“The Unix Philosophy” is some timeless wisdom. It has literally never steered me wrong. The majority of design patterns, the current vogue around functional concepts, strategies for not getting project deliverables wrong all have, at their heart, “The Unix Philosophy.” Written by Doug McIlroy, these four programming admonitions save lives, save time, and unleash potential. I’ve added small annotations in brackets. I admit I am standing on the shoulders of giants.
- Make each program do one thing well. To do a new job, build afresh rather than complicate old programs by adding new “features”. [This is currently having a renaissance in the resurgence of functional-style programming — composition of simple, easily-tested pure functions with no mutated state is vastly superior to complex decision code.]
- Expect the output of every program to become the input to another, as yet unknown, program. Don’t clutter output with extraneous information. Avoid stringently columnar or binary input formats. Don’t insist on interactive input. [This is often seen in the SOLID OOP design maxim: “Open for extension, closed for modification.” Code should be willing to hand-off and share with other code.]
- Design and build software, even operating systems, to be tried early, ideally within weeks. Don’t hesitate to throw away the clumsy parts and rebuild them. [Amazing! McIlroy prefigures Agile by about 25 years and says it in one sentence.]
- Use tools in preference to unskilled help to lighten a programming task, even if you have to detour to build the tools and expect to throw some of them out after you’ve finished using them. [Amazing! Don’t throw people at problems, automate for consistent debug cycles. This drives the convention over configuration decisions that we saw in Rails and which the React ecosystem has adopted. It’s also the heart of TDD.]
Source Wikipedia
“The Unix Philosophy” helps us work fast-and-dirty by building on each others' programs. It encourages “falling forward” and rapid iteration cycles. Discussing how this philosophy should be part of your daily command-line approach is beyond the scope of this post, but is a worthy use of time.
By the logic of “The Unix Philosophy,” then:
If I were to find a program that creates pretty visuals of graph data structures from ASCII, if I could get my program to generate the proper ASCII output, then I could get a pretty image of my tree. I’d contrast this to “The Non-Unix Philosophy” of “I need to download a graphics library and put that in with my BST implementation.” The first approach encourages collaboration, modularity, letting other experts buoy you up. I opted for that one.
Fortunately, such a graphics-generating program already exists, dot on OSX
provided by the Graphviz package available via Homebrew.
dot
$ ls -l `which dot`
lrwxr-xr-x  1 stevenharms  admin  33 Nov  9 10:31 /usr/local/bin/dot -> ../Cellar/graphviz/2.42.2/bin/dot
The dot program has a ton of options, but let’s start with the a typical use invocation:
A typical use of dot looks like:
dot -Ttype -oOutputFile inputfile
Common type values are pdf or png. The OutputFile name should accord with the -t you choose.
Here’s how I generated that simple DAG from earlier:
dot -Tpng -o simple.png simple.dot
But wait, what’s in simple.dot? Well, amazingly enough, it’s just a plaintext
file where nodes’ values point to each other with simple “skinny arrows” (->).
Digraph G{
  "2" -> "1"
  "2" -> "3"
}
In accordance with the Unix Philosophy, all I needed is for my_program to
generate some plain text that I could hand to dot to convert to a PDF or PNG
for me.
It’s beyond the scope of this post to discuss all the features of the dot
source-file syntax, but these are the resources I have thoroughly understood hackishly copy-and-garble-in-hopes-it-works.
- https://graphviz.gitlab.io/_pages/pdf/dotguide.pdf
- https://graphviz.herokuapp.com
- https://renenyffenegger.ch/notes/tools/Graphviz/examples/index
- https://www.graphviz.org/pdf/dotguide.pdf
- https://graphs.grevian.org/example
Build a Non-Trivial DAG
We know that we want to generate a DOT source file. I’m not including the code for the BST (try it out yourself!), but I do need to explain two methods of its API:
- It features a method called
insert()that takes a value, build it into aNode, and then positions thatNodeaccording to BST rules - It features a method called
printBFS()that uses breadth-first-search to print out all the nodes in the BST indotsource-file-compatible output
Code Showing Shuffle and BST Load
|
|
Which outputs:
Digraph G{
  "32" -> "13"
  "32" -> "61"
  "13" -> "8"
  ...
}
We save this output to a file by means of the redirection operator (>) and
then use that file as input to the dot command. Once the dot artifact is
created, we open that with the Preview application.
node binary_search_tree/runner.js > simple.dot && dot -Tpng -o simple.png simple.dot && open -a "Preview" simple.png
Protip: Consider binding mini-scriptlets like these to keybindings in your editor. This is easily done in
vimwithremap!and VSCode with thetasks.jsonfile.
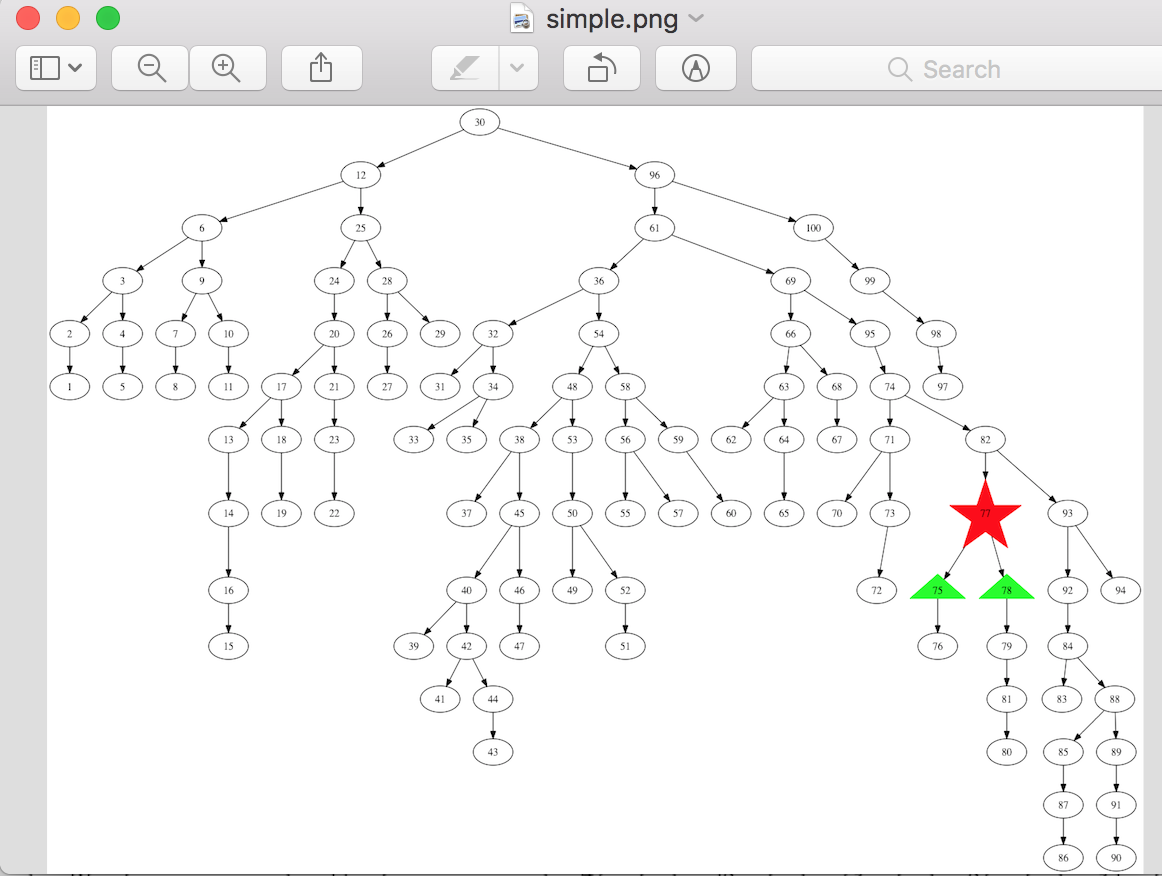
Preview opens up something like this:
Conclusion
In this post we’ve learned (or reviewed) “The Unix Philosophy,” an approach for
getting complex software collaborating in order to save us work. We’ve built a
program in JavaScript that builds a dot-compatible text source file which can
be given to dot to create beautiful directed graphs. In the next lesson in
this series, we’ll make our DAG source files richer so that we can visually
confirm that our BST operation of node-deletion worked.
As a preview of the future, let’s suppose we’ve decided to delete 77 and want
to see what happens to its children in another graph. We might start with
something like this: